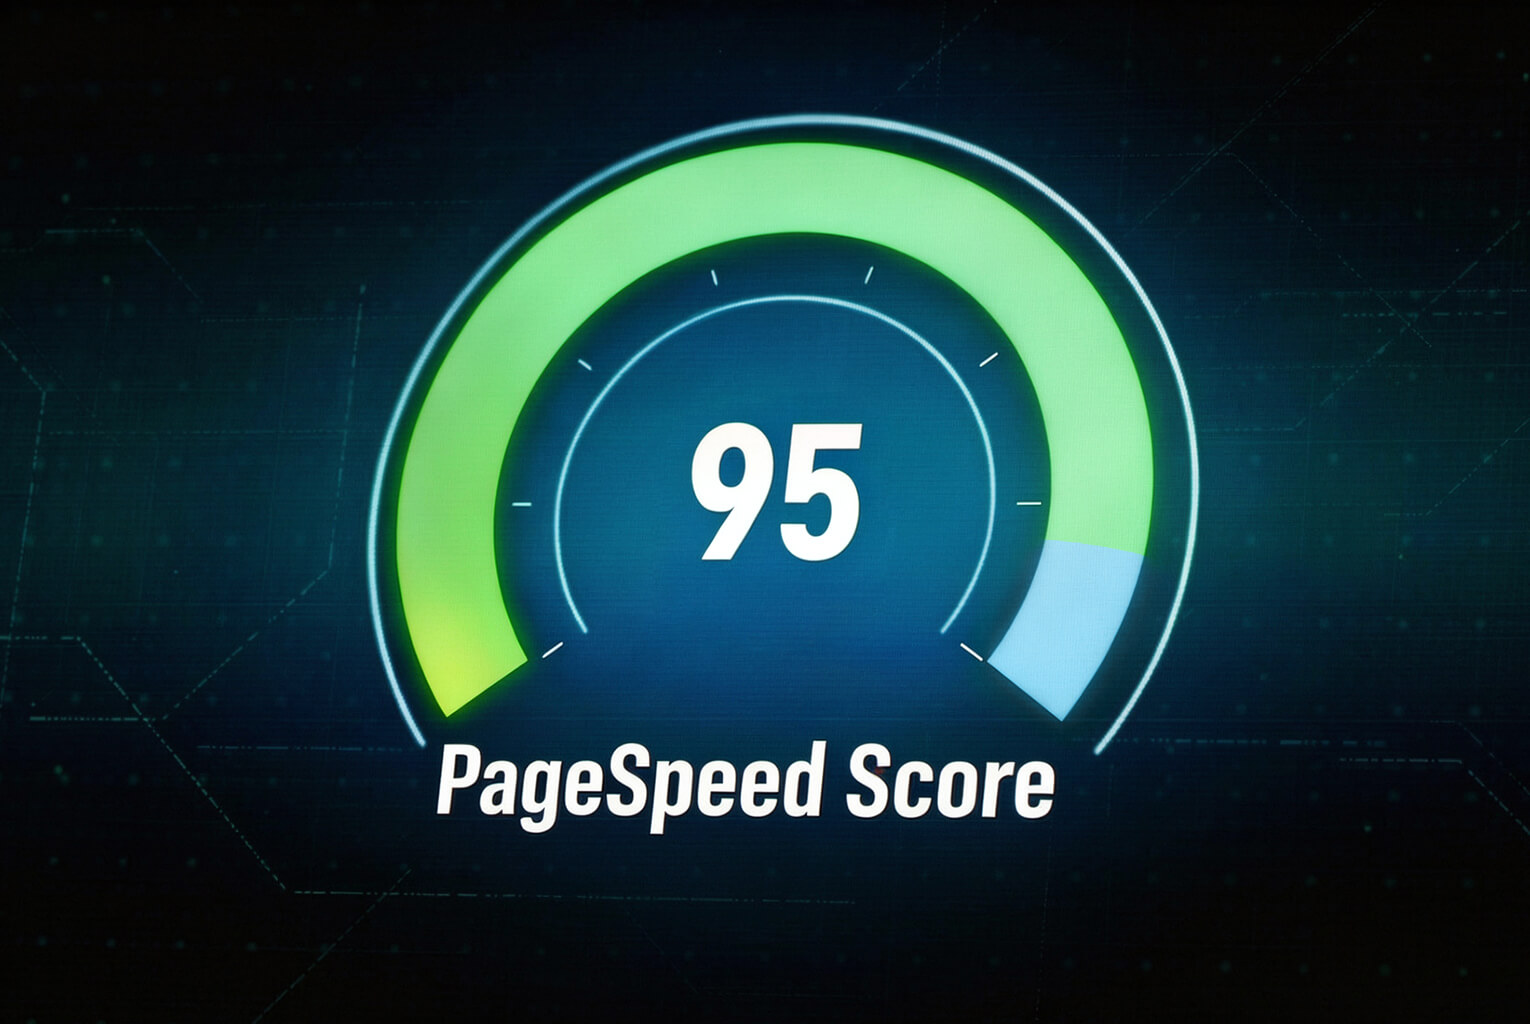
Quick Summary: In this example of a business WordPress website utilizing WordPress for an enterprise website, it was able to improve the mobile version’s Page Speed Score from 38 to 95 in just six weeks by using these tools and strategies:
• Hosting migration which reduced the Time To First Byte (TTFB) time frame by 90 percent to .18 seconds vs 1.4 seconds
• Image optimization which cut the page weight from 5.2 megabytes to 680 kilobytes
• Complete caching stack implementation
• Reducing plugins on the site from twenty-seven (27) down to fourteen (14)
• Optimizing CSS / JS code.”
Optimizing web pages for faster speeds has its uses in real life. There is a better outcome than theoretical outcomes. The following case study documents an actual WordPress speed optimization project. It shows all the steps taken in this project — from when the initial audit was performed until after the final steps of the solution were completed — and what could be measured about the results.
The client is a mid-size professional service company (a law firm) with a WordPress website that has evolved over the last four years. The client continued to add new plugins as needed. All images that have been uploaded have never been optimized. Since the time the site launched the client did not review or upgrade their hosting plan. While the site continues to work, it has slowed down considerably and Google confirmed it.
At the beginning of our process the mobile PageSpeed score was 38. After six weeks it was 95.
The Problem
Six months prior to our contact with the customer they had noticed a trend in declining Organic Search Traffic. In addition, there were increased complaints regarding slow loading pages from both customers and employees as well as on their mobile device.
PageSpeed Insights told the story. Mobile score = 38 (Out of 100) Desktop Score = 62 (Out Of 100). All of the Performance Thresholds that Google uses to measure performance for each of the Core Web Vital metrics were being failed by the site.
These were the exact performance metrics used to identify issues:
- The largest contentful paint (LCP) was at 6.8 seconds. The LCP threshold is less than 2.5 seconds.
- The interaction-to-next-paint (INP), which is the time for a user to interact with the website after it has loaded, averaged 480 milliseconds. The INP threshold is less than 200 milliseconds.
- The cumulative layout shift (CLS) average value was .32. The CLS threshold is below .10.
- The total weight of the webpage was 5.2 megabytes on the home page.
- There were 127 http requests during each page load.
- The time to first byte (tffb) of the webpage was 1.4 seconds.
The site did load. It worked. But it took so long to load that people would leave because of it, and it dragged down its search engine ranking. Performance decline is a slow process –– it doesn’t happen suddenly in a way that creates an immediate reaction; however, as time goes on, it can have serious consequences.
The Audit
Before we made any modifications, we conducted an exhaustive analysis. Knowing what is causing the issues avoids expending resources on fixing symptoms rather than the source of the issue.
Finding 1: Inefficient use of images. There were greater than 2000 images in our Media Library. All images had never been resized, nor optimized into newer image types. Our hero images are 3000px wide jpeg file types that range from 1.5 mb to 3mb depending upon the image type. Regardless of device size (and screen size), we serve them out at their native size. These images account for 72% of all page weight.
Finding 2: no page caching configuration was installed. there was no page caching plugin installed. Browser caching header configurations did not exist. A CDN wasn’t being utilized. Each time an individual visited a page, a brand new database query and PHP execution cycle occurred. The server created the same pages into the thousands daily for users that would have received the exact same content as if they came out of cache.
Finding 3: active plugins = 27. a review of the plugins found redundant function and bloat. 3 plugins offered duplicate or similar SEO functions. 2 plugins were used to handle contact form submissions (1 was never activated but still active). A social share plugin added 180kb of js on each page load as social button appear on blog posts. 1 abandoned a/B testing plugin was still executing scripts. 7 plugins hadn’t been updated in over a year.
Finding 4: shared hosting budget.
At launch, the website was launched using an eight dollar monthly “shared” hosting plan. This hosting account had PHP 7.4 (two major updates back) and had limited memory to allow for other sites also hosted on this server to use available memory. On its own, ttfb accounted for over one fourth of the recommended time that should be used to load all assets prior to the first asset being rendered.
Finding 5: render optimization was not utilized.
There were Seventeen CSS files and twenty two JavaScript files loading in the head section of the html document which blocked page rendering. There was no inlined critical CSS. All javascripts were loaded as they appeared in the source code without deferral. It wasn’t possible for the browser to start drawing anything from the page until after nearly 2 megabytes of content needed to be downloaded and processed by the browser.
The Solution
We approached each of our findings in a methodical way, starting at the ground level and building upward.
Step 1: Migration of Hosting. Our initial step was to migrate the website to a managed WordPress hosting platform which included PHP 8.3 as well as Server-Level Caching, HTTP/3 Support and built-in CDN. We successfully accomplished this migration without any downtime by utilizing a DNS-based cutover. After migrating to a managed WordPress hosting environment, we saw the TTFB decrease dramatically from 1.4 seconds to 180 ms immediately.
Step 2: Implementation of Image Pipeline. Next, we set up and configured an image optimization pipeline that would compress all images (both lossless and lossy) already on the website, convert them to WebP format with JPEG as a fallback, create responsive source sets for every image on the website, implement proper lazy loading (excluding our above-the-fold hero images) and deliver all media files via CDN. With the image pipeline fully operational, total image weight decreased from 3.7MB on the homepage to 420KB.
Step 3: Caching stack. I have created an entire cache stacking process; we are using page caching with correct cache busting for logged in customers and dynamic content, Redis object cache for returning database query results (from a wordpress site), CDN caching of all static content with correct cache control headers, and browser caching of statically cached, versioned content with large expiration time.
Step 4: Plugin audit and reduction. I was able to reduce our number of plugins from 27 down to 14. I combined redundant SEO plugins into one. I disabled the unused contact form plugin. I replaced the social sharing plugin with a lightweight social sharing plugin that will only load on blog posts. I deleted the abandoned a/B testing plugin. I upgraded Seven old plugins to new versions or replaced them with newer alternatives. Before pushing each deletion to production, i had fully tested it on my staging environment.
Step 5: Code optimization. Critical CSS and its inlining was done to ensure above-the-fold content is rendered properly. Non-critical CSS was moved below render. JavaScript files were either deferred, delayed until a user has interacted with the site, unused CSS was deleted (more than 340 KB of CSS that was loaded but had no impact on anything) as well as all remaining CSS and JavaScript files that could be minimized or merged have been.
Step 6: Database optimization. The 4200 unnecessary post revisions are now gone (only five revisions will occur for each post moving forward) the 12,000 expired transient items have been purged from memory, auto-loaded option sizes have been reduced by over 85% (from 2.8 MB to 340 KB), clean up of orphaned meta data from removed plugins have occurred, and all database tables have been optimized.
The Results
Six weeks from project start to end. The before-and-after numbers speak clearly.
| Metric | Before | After | Improvement |
|---|---|---|---|
| PageSpeed Mobile | 38 | 95 | +57 points |
| PageSpeed Desktop | 62 | 99 | +37 points |
| LCP | 6.8s | 1.4s | 79% faster |
| INP | 480ms | 120ms | 75% faster |
| CLS | 0.32 | 0.03 | 91% reduction |
| TTFB | 1.4s | 0.18s | 87% faster |
| Page Weight | 5.2MB | 680KB | 87% lighter |
| HTTP Requests | 127 | 34 | 73% fewer |
Core Web Vitals status: All three metrics moved from “poor” (red) to “good” (green) across both mobile and desktop.
Traffic impact: Organic Search Traffic grew by 32% over the next three months after optimizing the site. I am sure it is purely coincidental that Organic Search Traffic growth occurred at the exact same time as Core Web Vitals improved in Google’s field data for the site and we did make any other major SEO updates to the site around this time.
Bounce rate impact: Mobile Bounce Rate went from 67% to 41%. People who would leave without even finishing reading a page are now reading pages and interacting with the content.
Business impact: The Client has stated they have noticed an increase in Contact Form Submissions and that there is also a positive trend in their overall client satisfaction regarding the website user experience. They have gone from feeling slightly embarrassed about the website to having a sense of Professional Pride.
Client Testimonial
“We knew the site was slow but did not realize how much it was affecting us. The difference is night and day — pages load instantly now, and we have seen a genuine increase in inquiries since the optimization. The ongoing maintenance gives us confidence it will stay this way.”
Key Takeaways
Slowdowns are usually gradual. The website wasn’t slow last week. It didn’t take four years to build up to a point where it would harm the business. Slowdowns can be built with each addition or modification made along the way (a new plugin here, an un-optimized image there, etc.). A regular maintenance routine will help prevent those kinds of slowdowns from building.
Your host has more to do than you think. In terms of improving page load time, migrating to a better host can make the biggest difference. No matter how much time you spend optimizing your front end code, if your server is taking longer than 500ms to send back data, no one cares about what you’ve done on the front end.
Maintenance and reducing unnecessary plugins is just as important. Cutting down 13 (from 27) didn’t eliminate anything that was being used by the clients but instead reduced redundancy, eliminated abandoned projects/experiments and bloat. Each and every plugin should have a purpose and be utilized in some form before you allow it into your WordPress install. To learn how to manage and optimize your plugins for maximum efficiency, read our speed optimization techniques guide.
Speed is a long-term strategy not a short-term fix. After this client has been placed on a Deutrix Care WordPress Maintenance Plan we will monitor and continue to optimize his websites’ performance. If they weren’t under a long term plan they would eventually see the same slow-down issues that originally created the need for the first optimization.
ROI is very simple to determine. Total cost of the initial optimization project and ongoing care is significantly less than the total potential lost revenue due to better search engine placement, lower bounce rate, better overall user experience. Any business dependent on their website understands that speed optimizations are not costs – they’re investments with tangible outcomes.
Want results like these for your site? Get a free speed audit →
Or explore our ongoing optimization service. Deutrix Care speed optimization →
This article is part of our WordPress Speed Optimization Guide — the complete resource for maintaining a fast, secure WordPress site.